


San Diego Real Estate Market Analysis – 3rd Quarter 2014
San Diego County Residential Real Estate Market Analysis
©2014 By Mark A. Melikian California Certified Residential Appraiser appraisals@san.rr.com P.O. Box 3051 Del Mar, California 92014 858-793-9339
The following is a market data summary of detached and attached properties as reported by the San Diego County MLS system. The data includes all zip codes in San Diego County. * All 2014 data in figures 1 through 4 will be projected based on market data taken from January through September as reported by the San Diego County MLS system. All projections discussed in this analysis will be updated throughout the year in subsequent quarterly reports.
San Diego Real Estate Market Overview:
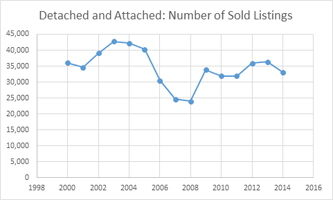
The data provided analyzes residential real estate sales beginning in the year 2000, which is used as the base year. The number of sold listings in San Diego County peaked in 2003 at 42,746 units and decreased through 2008 to 23,972 units. *The 2014 projection shows the total number of units sold for the year will be 33,105 (see figure 1).
San Diego County Housing Market Forecast
San Diego County Residential Real Estate Market Analysis: 2nd Quarter 2011
By Mark A. Melikian California Certified Residential Appraiser appraisals@san.rr.com P.O. Box 3051 Del Mar, California 92014 858-793-9339
This part3 of 3
Detached Housing Market Specifics – 2nd Quarter 2010 compared with 2nd Quarter 2011: Detached home sales data for the 2nd quarter of 2011 shows the highest number of sales were in the $300,000-$400,000 price range. This is consistent with the 2nd quarter of 2010, when the highest number of sales were in the same $300,000-$400,000 price range (see figure 5). Read more 
San Diego Housing Market Bottom?

San Diego housing market
Home prices are still a bubble compared to historic norm. According to Case Shiller index, we are still 20% above long term averages. Typical bottom comes at 20% below average. But this is not your typical recession. This is a deflationary crash. This is Great Depression material. These averages themselves are based on a money supply that was inflated by borrowing for many decades. When the money supply deflates, existing prices and salaries cannot be sustained.
Past generations paid less for housing compared to their income. Whatever you do, do not get into too much debt. If you want to buy, buy cash down or with a large down payment. Even if prices do not fall, in many cases, renting can be cheaper if you consider mortgage interest, property taxes, condo fees, maintenance, lost interest/investment income…