


San Diego Real Estate Market Analysis – 3rd Quarter 2014
San Diego County Residential Real Estate Market Analysis
©2014 By Mark A. Melikian California Certified Residential Appraiser appraisals@san.rr.com P.O. Box 3051 Del Mar, California 92014 858-793-9339
The following is a market data summary of detached and attached properties as reported by the San Diego County MLS system. The data includes all zip codes in San Diego County. * All 2014 data in figures 1 through 4 will be projected based on market data taken from January through September as reported by the San Diego County MLS system. All projections discussed in this analysis will be updated throughout the year in subsequent quarterly reports.
San Diego Real Estate Market Overview:
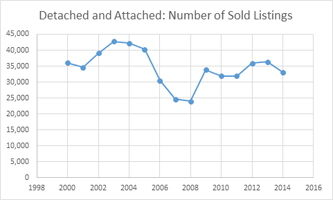
The data provided analyzes residential real estate sales beginning in the year 2000, which is used as the base year. The number of sold listings in San Diego County peaked in 2003 at 42,746 units and decreased through 2008 to 23,972 units. *The 2014 projection shows the total number of units sold for the year will be 33,105 (see figure 1).
San Diego County Market Overview:
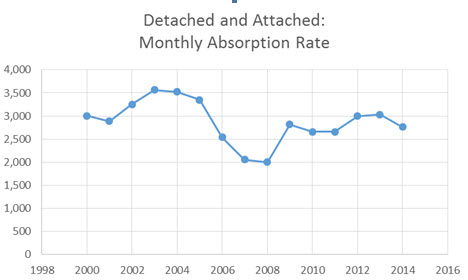
The monthly absorption rate (number of units sold in a given month) will mirror the trend we see in the number of sold listings. The peak monthly absorption rate occurred in 2003 with 3,562 units selling per month. In 2008, the monthly absorption rate decreased to a low of 1,998 units. *The projection for 2014 shows a monthly absorption rate of 2,759 units (see figure 2).
 San Diego Housing Market Overview:
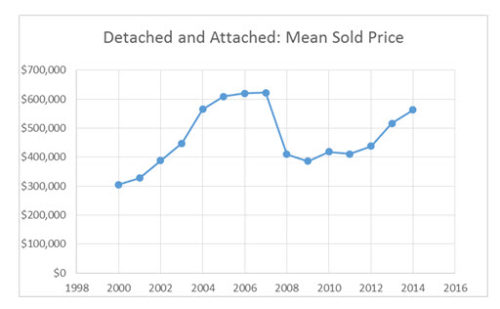
The mean sold price for a housing unit in San Diego County peaked in 2007 at $621,675. The mean sold price in 2009 decreased to a low of $385,754, a 37.9 percent decrease from the market peak in 2007. *In 2014, the projected mean sold price is $563,231, which would be a 9.4 percent decline from the market peak. Conversely, this would be an 8.9 percent increase over last year’s mean sold price of $516,983 (see figure 3).
San Diego California Real Estate Market Overview:
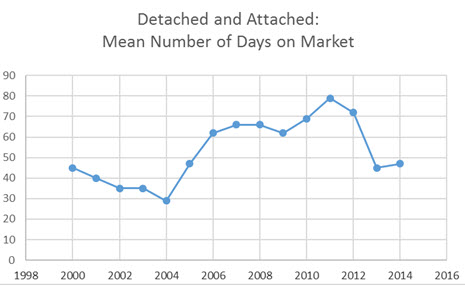
The mean number of days a property was on the market in San Diego County reached a low of 29 in 2004. *The projection for 2014 shows the mean number of days on market to be at 47, two days more than the 45 days in 2013 (see figure 4).
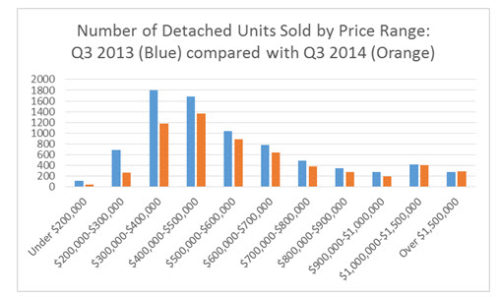
Detached Housing Market Specifics – 3rd Quarter 2013 compared with 3rd Quarter 2014:
Detached home sales data for the 3rd quarter of 2014 shows the highest number of sales were in the $400,000-$500,000 price range (1,365 units). The highest number of sales for the 3rd quarter of 2013 were in the $300,000-$400,000 price range (1,803 units – see figure 5).
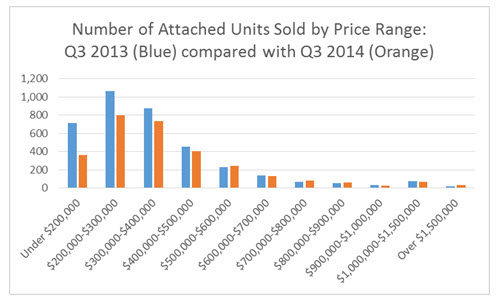
Attached Housing Market Specifics – 3rd Quarter 2013 compared with 3rd Quarter 2014: Attached home sales data for the 3rd quarter of 2014 shows the highest number of sales were in the $200,000-$300,000 price range (802 units). The highest number of sales for the 3rd quarter of 2013 were also in the $200,000- $300,000 price range (1,068 units – see figure 6).
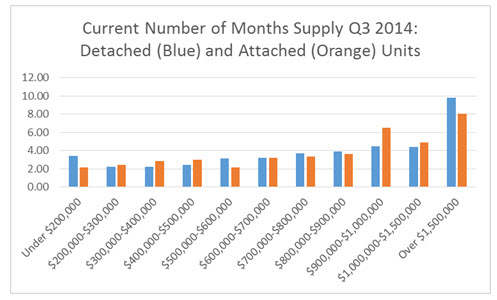
Detached and Attached Housing Market Specifics – 3nd Quarter 2014 Housing Supply:
Normal residential real estate markets typically have a six to seven month supply of housing inventory. Based on 3rd quarter 2014 absorption rates, current supply levels for detached properties are at (or below) normal market levels up to the $1,500,000 plus price ranges. Similarly, current supply levels for attached properties are at (or below) normal market levels up to the $1,500,000 plus price ranges (see figure 7).
San Diego Real Estate Market Comments and Outlook:
Based on the first nine months of the year, projections for the 2014 San Diego County housing market show sales volume and absorption rates to decrease while sales prices and days on market will increase. This forecast is consistent with feedback from local professionals regarding activity in our residential real estate market during the third quarter of 2014 and mirrors the outlook from the second quarter of 2014.
The highest volume of 2014 sales activity for attached units is projected to be below $400,000 and the highest volume of 2014 sales activity for detached units is projected to be below $500,000.
Inventory levels across all price ranges and property types in the third quarter of 2014 increased over those in the first quarter of 2014 (continuing a trend from the last quarter of 2013). Despite these increases, the supply of active listings across most price ranges are still at relatively low levels (see figure 7). The impact of the recent increase in supply levels will be analyzed in subsequent reports.
Current inventory levels and the decreased absorption rates (see figure 2) suggest a slowdown in the rate of price increases for 2014. Overall, prices in San Diego County rose approximately 18 percent during 2013, while the projected price increase for 2014 is 8.9 percent (see figure 3).
With the highest concentration of housing continuing to sell below $500,000, real estate professionals should focus on these price points. As noted above, the market has seen an increase in inventory levels over the past quarter. This potential impact on price appreciation will be analyzed in subsequent reports.
Comments are closed.