


San Diego Real Estate Market 2018
San Diego County Residential Real Estate Market Analysis:
3rd Quarter 2018
©2018 Mark A. Melikian California Certified Residential Appraiser appraisals@san.rr.com P.O. Box 3051 Del Mar, California 92014 858-945-8996
San Diego Real Estate Market 2018
The following is a market data summary of detached and attached properties as reported by the San Diego County MLS system. The data includes all zip codes in San Diego County. All projections discussed in this analysis will be updated throughout the year in subsequent quarterly reports.
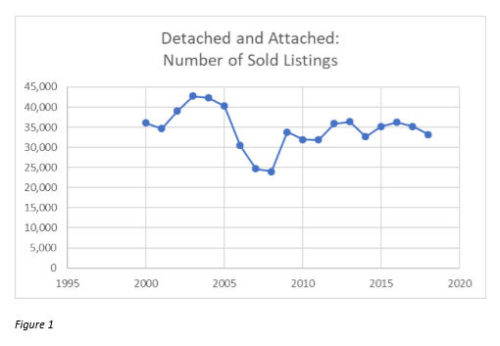
San Diego Market Overview – Number of Sales: The data provided analyzes residential real estate sales beginning in the year 2000, which is used as the base year. The number of sold listings in San Diego County peaked in 2003 at 42,746 units and decreased through 2008 to 23,972 units. In 2018, the total number of units sold, based on the first three quarter results, is projected to be 33,164, down from 35,200 sales in 2017 (see Figure 1).
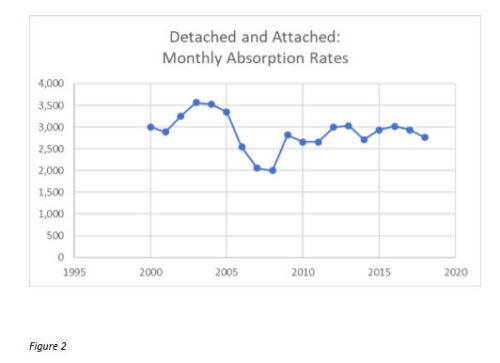
San Diego Market Overview – Absorption Rates: The monthly absorption rate (number of units sold in a month) will mirror the trend we see in the number of sold listings. The peak monthly absorption rate occurred in 2003 with 3,562 units selling per month. In 2008, the monthly absorption rate decreased to a low of 1,998 units. The 2018 projected monthly absorption rate, based on first three quarter results, is 2,764 units, down from 2,933 units in 2017 (see Figure 2).
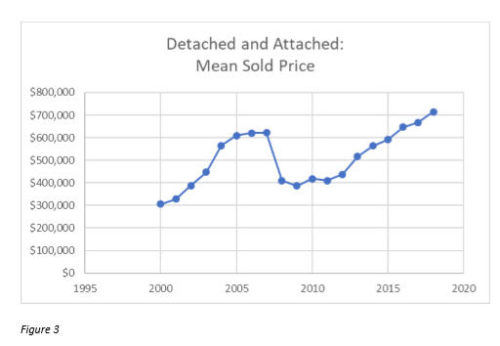
San Diego Market Overview – Sales Price: The mean sold price for a housing unit in San Diego County is projected to reach a new high this year, based on first three quarter results. The current 2018 projection is for a mean sale price of $714,527.
San Diego Real Estate Market 2018 Analysis
This would surpass the previous peak of $666,903 set in 2017. The currently projected mean sold price reflects a 7.1 percent increase over last year’s mean sold price (see Figure 3).
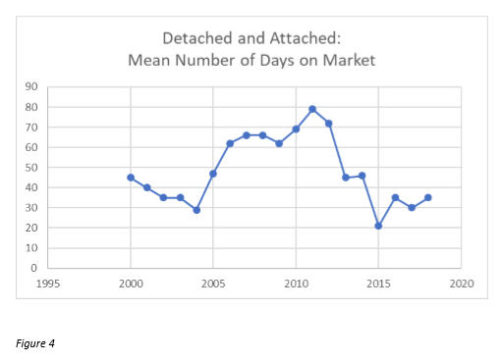
San Diego Market Overview – Days on Market: The mean number of days a property is on the market, based on first three quarter data, will be at 35 days in 2018. In 2011, that number peaked at 79 days on market. In 2015, the number of days on market hit an all-time low of 21 (see Figure 4).
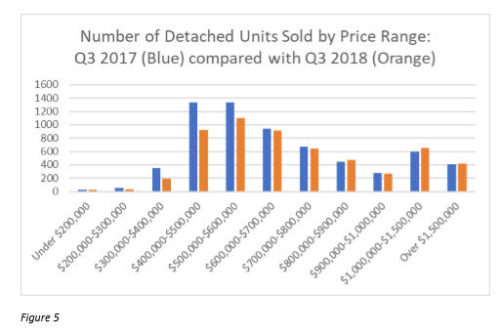
Detached Housing Market Specifics – 3rd Quarter 2018 compared with 3rd Quarter 2017: Detached home sales data for the 3rd quarter of 2018 shows the highest number of sales were in the $500,000-$600,000 price range (1,105 units). The highest number of sales for the 3rd quarter of 2017 were in the same $500,000-$600,000 price range (1,341 units) (see Figure 5).
Attached Housing Market Specifics – 3rd Quarter 2018 compared with 3rd Quarter 2017: Attached home sales data for the 3rd quarter of 2018 shows the highest number of sales were in the $300,000-$400,000 price range (789 units). The highest number of sales for the 3rd quarter of 2017 was in the same $300,000- $400,000 price range (985 units) (see Figure 6).

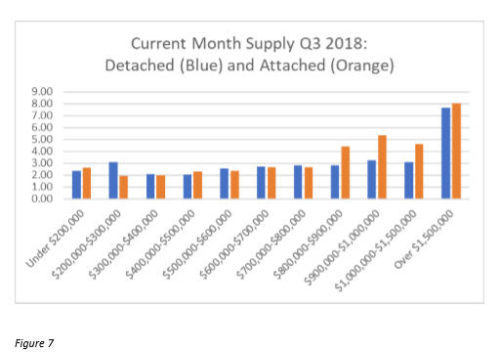
Detached and Attached Housing Market Specifics – 3rd Quarter 2018 Housing Supply: Normal residential real estate markets typically have a six to seven-month supply of housing inventory. Based on 3rd quarter 2018 absorption rates, current supply levels for detached properties are at (or below) normal market levels across all price except the $1,500,000 and up category. Similarly, current supply levels for attached properties are at (or below) normal market levels across all price ranges except the $1,500,000 and up category (see Figure 7).
Comments and Outlook – Based on the third quarter MLS data, the San Diego County housing market projections for 2018 are:
➢ Sales volume is on pace to decrease compared to last year (see Figure 1).
➢ Absorption rates are on pace to decrease compared to last year (see Figure 2).
➢ Sales prices are on pace to increase by 7.1 percent over those of 2017. The county’s mean sales price is set to reach a new high of $714,527, surpassing the previous high set in 2017 (see Figure 3).
➢ Days on market are on pace to increase compared to last year (see Figure 4).
The highest concentration of detached housing sales includes inventory priced below $600,000 (see Figure 5). The highest concentration of attached housing sales includes inventory priced below $500,000 (see Figure 6). Most sales activity continues to remain in these relatively lower price ranges, which is largely comprised of entry level housing.
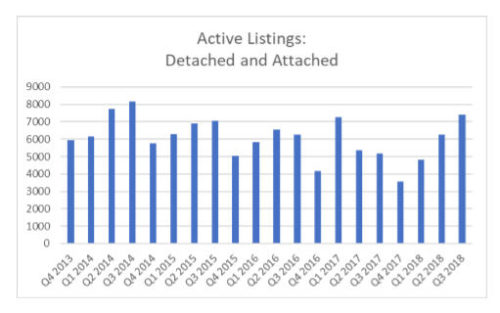
Inventory levels of detached and attached units increased in again in the third quarter of 2018, continuing a four consecutive quarter trend beginning in Q4 2017. Looking back five years, the current inventory levels are the highest since Q3 2014 (see chart below). As noted in last quarter’s report and depicted in Figure 7’s chart, more inventory is still needed in the lower price points (specifically, more detached home listings priced under $600,000 and attached home listings priced under $400,000).
San Diego Real Estate Market 2018
Subsequent reports will continue to analyze the trends in local housing supplies, sales volume and sales prices.
Learn more about San Diego California at their official website.
San Diego Real Estate Market 2018
Comments are closed.