


San Diego Housing Market Analysis 4th Quarter 2016
San Diego Housing Market Analysis
©2016 By Mark A. Melikian California Certified Residential Appraiser appraisals@san.rr.com P.O. Box 3051 Del Mar, California 92014 858-945-8996
The following is a market data summary of detached and attached properties as reported by the San Diego County MLS system. The data includes all zip codes in San Diego County. All projections discussed in this analysis will be updated throughout the year in subsequent quarterly reports.
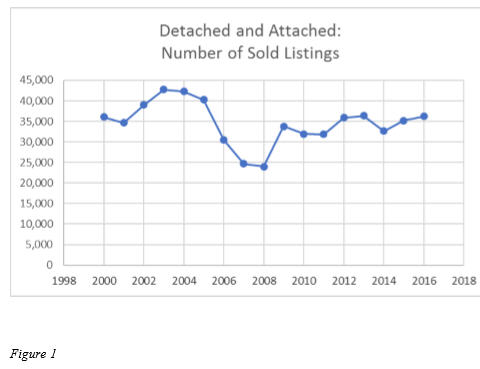
San Diego Housing Market Overview: The data provided analyzes residential real estate sales beginning in the year 2000, which is used as the base year. The number of sold listings in San Diego County peaked in 2003 at 42,746 units and decreased through 2008 to 23,972 units. In 2016, the total number of units sold for the year was 36,236, up from 35,232 sales in 2015 (see Figure 1).
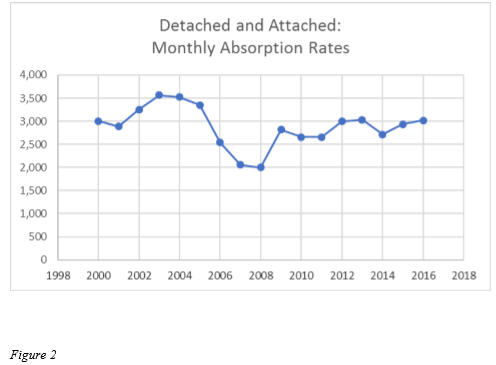
Market Overview: The monthly absorption rate (number of units sold in a given month) will mirror the trend we see in the number of sold listings. The peak monthly absorption rate occurred in 2003 with 3,562 units selling per month. In 2008, the monthly absorption rate decreased to a low of 1,998 units. The 2016 monthly absorption rate was 3,020 units, up from 2,936 units in 2015 (see Figure 2).
San Diego housing market
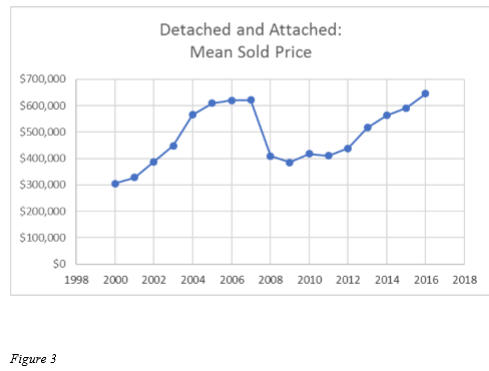
Market Overview: The mean sold price for a housing unit in San Diego County peaked in 2016 at $646,201, surpassing the previous peak of $621,675 in 2007. The mean sold price in 2015 was $590,720. The current mean sold price reflects an 8.6 percent increase over last year’s mean sold price (see Figure 3).
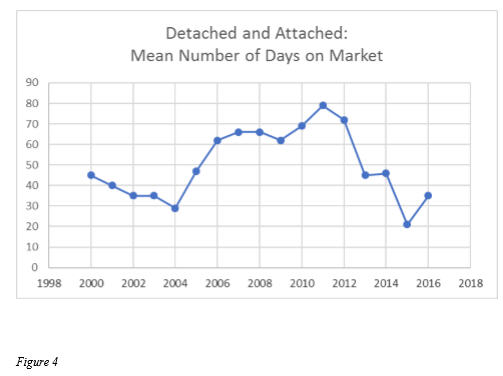
Market Overview: The mean number of days a property was on the market in San Diego County was 35 in 2015. In 2011, that number peaked at 79 days on market. The 2016 mean number of days was an increase from the 2015 mean number of days of 21 (see Figure 4).
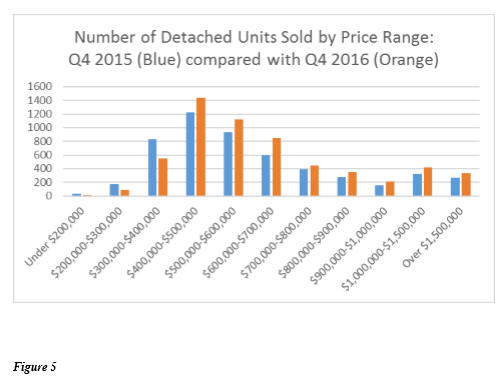
Detached Housing Market Specifics – 4th Quarter 2015 compared with 4th Quarter 2016: Detached home sales data for the 4th quarter of 2016 shows the highest number of sales were in the $400,000-$500,000 price range (1,444 units). The highest number of sales for the 4th quarter of 2015 were in the same $400,000-$500,000 price range (1,220 units – see Figure 5).
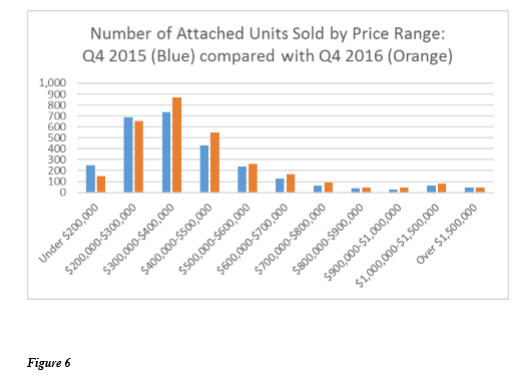
Attached Housing Market Specifics – 4th Quarter 2015 compared with 4th Quarter 2016: Attached home sales data for the 4th quarter of 2016 shows the highest number of sales were in the $300,000-$400,000 price range (871 units). The highest number of sales for the 4th quarter of 2015 were in the same $300,000- $400,000 price range (734 units – see Figure 6).
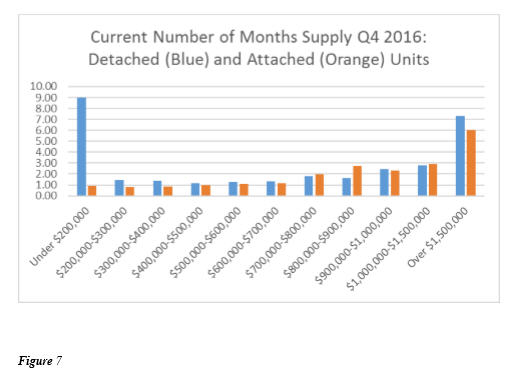
Detached and Attached Housing Market Specifics – 4th Quarter 2016 Housing Supply: Normal residential real estate markets typically have a six to seven month supply of housing inventory. Based on 4th quarter 2016 absorption rates, current supply levels for detached properties are at (or below) normal market levels in the under $200,000 price range and the $1,500,000 plus price range. All current supply levels for attached properties are at (or below) normal market levels across all price ranges (see Figure 7).
San Diego Housing Market – Comments and Outlook: In 2016, the San Diego County housing market’s sale prices, sales volume, absorption rates and days on market increased, year over year. In 2016, the rate of price appreciation was 8.6 percent. The county’s mean sales price reached a new high, surpassing the previous high set at the peak of the housing boom in 2007 (see Figure 3).
Inventory levels decreased across all price ranges and property types in the fourth quarter of 2016 compared with inventory levels in the third quarter of 2016. Accordingly, the supply levels of active listings across most price ranges currently remains at relatively low levels (see Figure 7).
The highest concentration of detached housing sales includes inventory priced below $500,000 (see Figure 5). The highest concentration of attached housing sales includes inventory priced below $500,000, now similar to the detached market (see Figure 6). Most sales activity continues to remain in these lower price ranges, which is largely comprised of entry level housing.
Housing supply is below normal levels in most price ranges which will likely create a competitive environment for buyers during the first quarter of 2017, assuming interest rates are not a factor. Many real estate professionals continue to report multiple offers on entry level listings with a continuation of a two-tiered market: Multiple offers are being reported on fixer properties which have the potential for renovation and resale. Multiple offers are also being reported on renovated houses that are priced competitively. Subsequent reports will continue to analyze the trends in local housing supplies, sales volume and sales prices.
Learn more about San Diego City website
San Diego Housing Market
Comments are closed.