


San Diego County Residential Real Estate Market Analysis
San Diego County Residential Real Estate Market Analysis: 3rd Quarter 2016
©2016 By Mark A. Melikian California Certified Residential Appraiser appraisals@san.rr.com P.O. Box 3051 Del Mar, California 92014 858-945-8996
The following is a market data summary of detached and attached properties as reported by the San Diego County MLS system between January 1, 2016 and September 30, 2016. The data includes all zip codes in San Diego County. All projections discussed in this analysis will be updated throughout the year in subsequent quarterly reports.
San Diego County Residential Real Estate Market Analysis
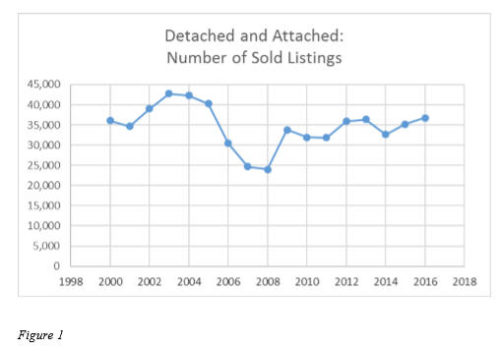
Market Overview: The data provided analyzes residential real estate sales beginning in the year 2000, which is used as the base year. The number of sold listings in San Diego County peaked in 2003 at 42,746 units and decreased through 2008 to 23,972 units. In 2016 the projected total number of units sold for the year will be 36,784, up from 35,232 sales in 2015 (see figure 1).
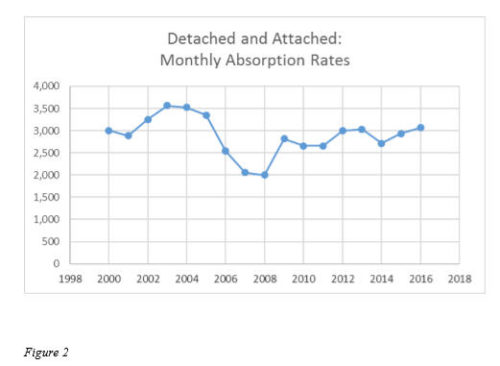
Market Overview: The monthly absorption rate (number of units sold in a given month) will mirror the trend we see in the number of sold listings. The peak monthly absorption rate occurred in 2003 with 3,562 units selling per month. In 2008 the monthly absorption rate decreased to a low of 1,998 units. The 2016 projected monthly absorption rate will be 3,065 units, up from 2,936 units in 2015 (see figure 2).
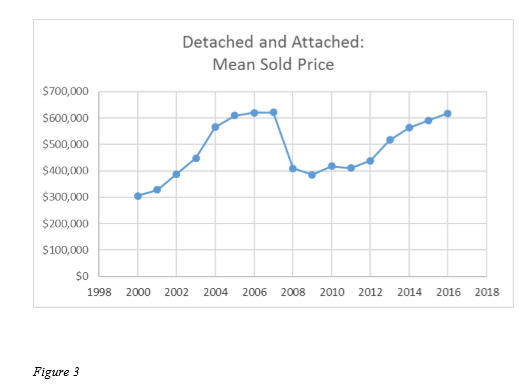
Market Overview: The mean sold price for a housing unit in San Diego County peaked in 2007 at $621,675. The mean sold price in 2009 decreased to a low of $385,754, a 37.9 percent decrease from the market peak in 2007. The projected mean sold price in 2016 will be $617,492, which is a .7 percent decline from the market peak. Conversely, this is a 4.5 percent increase over last year’s mean sold price of $590,720 (see figure 3).
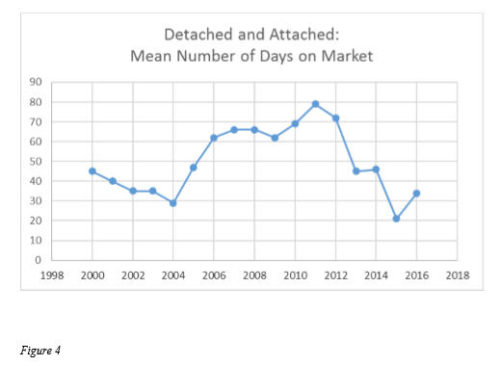
Market Overview: The mean number of days a property was on the market in San Diego County is projected to be 34 in 2016. In 2011, that number peaked at 79 days on market. The lowest number of days on market 21, which occurred in 2015 (see figure 4).
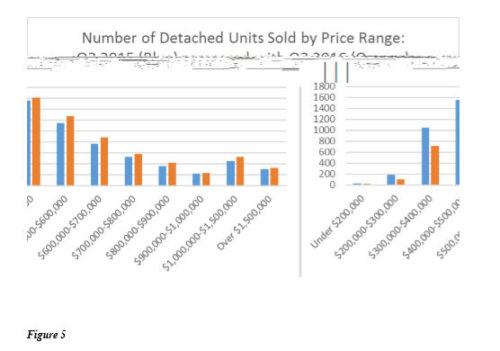
Detached Housing Market Specifics – 3rd Quarter 2015 compared with 3rd Quarter 2016: Detached home sales data for the 3rd quarter of 2016 shows the highest number of sales were in the $400,000-$500,000 price range (1,611 units). This is similar to last year when the highest number of sales for the 3rd quarter of 2015 were in the same price range (1,559 units – see figure 5).
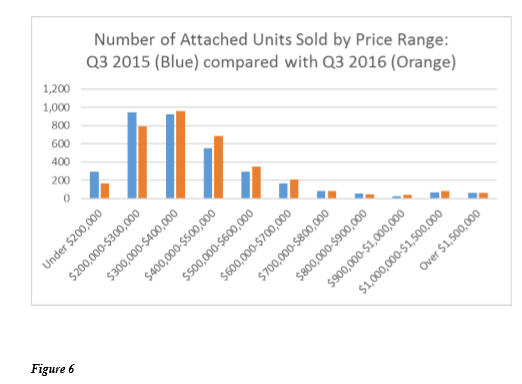
Attached Housing Market Specifics – 3rd Quarter 2015 compared with 3rd Quarter 2016: Attached home sales data for the 3rd quarter of 2016 shows the highest number of sales were in the $300,000-$400,000 price range (963 units). This is an increase over last year when the highest number of sales for the 3rd quarter of 2015 were in the $200,000-$300,000 price range (947 units – see figure 6).
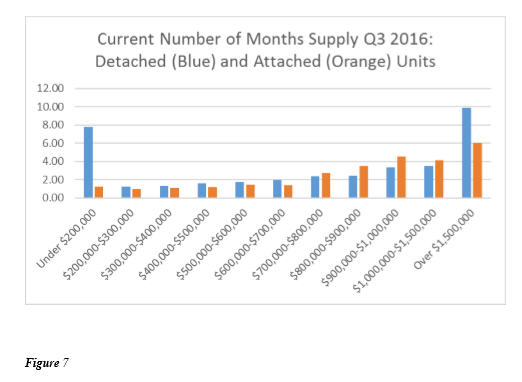
Detached and Attached Housing Market Specifics – 3rd Quarter 2016 Housing Supply: Normal residential real estate markets typically have a six to seven month supply of housing inventory. Based on 3rd quarter 2016 absorption rates, current supply levels for attached properties are at (or below) normal market levels across all price ranges. Current supply levels for attached properties are at (or below) normal market levels from $200,000 up to $1,500,000, with above normal supply levels in the lowest and highest price ranges (see figure 7).
San Diego County Residential Real Estate Market Analysis
Comments and Outlook: In 2016, the San Diego County housing market’s mean sale price is projected to increase 4.5 percent over the mean sale price of 2015. The number of units sold, days on market and absorption rates are projected to increase as well (see figures 1, 2, 3 and 4).
Inventory levels across most price ranges remain at relatively low levels (see figure 7).
The highest concentration of detached housing sales includes inventory priced below $600,000 (see figure 5). The highest concentration of attached housing sales includes inventory priced below $500,000 (see figure 6). Buyers in these price ranges locally are largely comprised of first time buyers and investors.
Housing supply is below normal levels in most price ranges which will likely cause the continuation of a competitive environment for most buyers during the fourth quarter of 2016. Many real estate professionals continue to report multiple offers on entry level listings with a two tier market continuing: Multiple offers are being reported on fixer properties which have the potential for renovation and resale. Multiple offers are also being reported on renovated houses that are priced well.
In San Diego county there has been a drop in sales volume during the third quarter of 2016 (6,839 total units) as compared to the second quarter of 2016 (13,782 total units). While sales volume has declined, prices have continued on a steady climb in the third quarter. Marketing times have remained relatively stable in our market. Future reports will continue to monitor local inventory levels, marketing times and sales prices.
San Diego County Residential Real Estate Market Analysis: 3rd Quarter 2016 ©2016
Comments are closed.