


Home Price Reductions
Home Price Reductions on Active Listings
A quick look add a real estate market leading indicator, price reductions on active listings, in a couple of main Metro areas in California and Arizona.

Keep in mind when looking at the charts, the notice the trendline of today’s price reductions versus price reductions last year in 2021. Read more 
California Real Estate – It’s Over!
California Real Estate – It’s Over!
Yes, I’ve seen this before in 2005. . .home prices still going up while home sales are falling!
For those of you who may not be regular readers here is the link to the first warning blog post that I put out; my first post where I called the real estate market top was June 15, 2021 (https://www.brokerforyou.com/brokerforyou/real-estate-market-downturn/ ) . On June 17 I had a follow-up post ( https://www.brokerforyou.com/brokerforyou/real-estate-market-bust/ ) where I added additional indicators, that to me showed that the market was in a topping phase right now! I put the links to each one of those prior post above, and would suggest if you’re interested, to reread those posts! Read more
Home Prices
Home Prices – S&P CoreLogic Case-Shiller YEAR-OVER-YEARÂ
The S&P CoreLogic Case-Shiller U.S. National Home Price NSA Index, covering all nine U.S. census divisions, reported a 14.6% annual gain in April, up from 13.3% in the previous month. The 10-City Composite annual increase came in at 14.4%, up from 12.9% in the previous month. The 20-City Composite posted a 14.9% year-over-year gain, up from 13.4% in the previous month.
Phoenix, San Diego, and Seattle reported the highest year-over-year gains among the 20 cities in April. Phoenix led the way with a 22.3% year-over-year price increase, followed by San Diego with a 21.6% increase and Seattle with a 20.2% increase. All 20 cities reported higher price increases in the year ending April 2021 versus the year ending March 2021. Read more
CASE-SHILLER HOME PRICES
Latest home price report from the Case-Shiller index

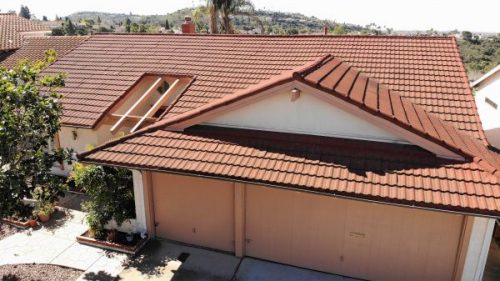
San Carlos Backyard Sunset
CASE-SHILLER home prices for their 20 city index were all up in the latest report released yesterday.
S&P Dow Jones Indices released the latest results for the S&P
CoreLogic Case-Shiller Indices, the leading measure of U.S. home prices. Data released for January 2018 shows that home prices continued their rise across the country over the last 12 months. Read more
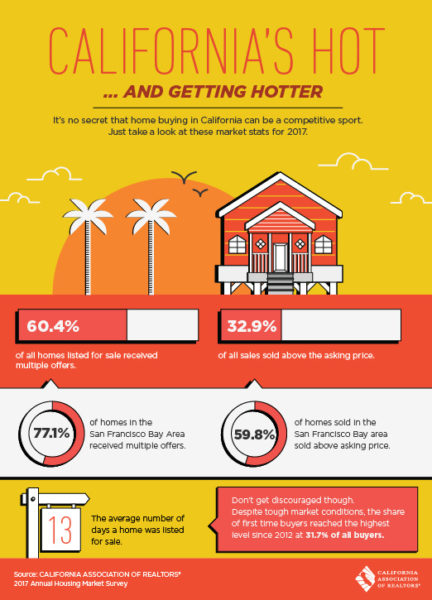
California’s HOT Real Estate Market
California’s HOT Real Estate Market
Data from the California Association of realtors shows that the average residential detached home sales price it $605,000 in December 2017! in January 2018, the average residential detached home in San Diego selling price was actually a little lower and came in at $590,000!
California’s HOT Real Estate Market
Now, $590,000 for the average detached home in San Diego is a hell of a lot of money! But, for comparison purposes, out of the six Southern California areas ( Los Angeles, Orange,Riverside, San Bernardino, San Diego, and Ventura) in this report, San Diego actually came in and third-place. of the six Southern California areas in the report the average residential sales price for a detached home was the highest in Orange County, at a staggering $780,000! in second place, was Ventura at $660,720. the lowest priced average home sale for the six areas studied in Southern California was San Bernardino, which came in at $277,000. Read more
San Diego real estate market Outlook 2018
San Diego real estate market Outlook 2018
As I write this, the final figures for the fourth quarter of 2017 are not in yet. But it seems that a number of insiders believe that the average home appreciation in San Diego will be approximately 7.2% for 2017.
One major real estate tracking analytical firm has come out with for projection of average appreciation for 2018 in San Diego California of approximately 4.2%. so, you may be asking yourself why the three percentage point drop in the forecast for home appreciation for 2018? I’m going to give my opinion here with my thoughts on why the San Diego home values will not be a strong this year as they were in 2017. Naturally, I’m just a real estate broker and not an economist. But, with that said I’m sure if he got 10 economist in a room and asked them what they thought the average appreciation for San Diego real estate would be in 2018 you would get 10 different opinions.
So, here is my personal opinion on what I see for the San Diego residential real estate market in 2018: Read more
Home Values Growth – Fastest Rate in Nearly Three Years
Home prices up at fastest rate in nearly three years!
 Home Values Growth – Case-Shiller index sees fastest growth since mid-2014.
In just one word, HOT, describes the US residential housing market right now!
Sure, there are many out there right now for forecasting the US housing bubble, or in the very least, a topping out for the momentum in the housing market. But, according to the latest S&P/Case-Shiller 20-city index report, it would seem that these negative forecasters are 180° off base! the latest S&P Case-Shiller 20 city index was up 5.7% when compared to the same time period last year. Read more
San Diego Home Prices 2017
San Diego Home Prices 2017
 San Diego County Residential Real Estate Market Analysis: 1st Quarter 2017 ©2017
By Mark A. Melikian California Certified Residential Appraiser appraisals@san.rr.com P.O. Box 3051 Del Mar, California 92014 858-945-8996
The following is a market data summary of detached and attached properties as reported by the San Diego County MLS system. The data includes all zip codes in San Diego County. All projections discussed in this analysis will be updated throughout the year in subsequent quarterly reports. Read more
San Diego Home Prices Hit Decade High
San Diego Home Prices Hit Decade High
A real estate trend tracking company just reported that the San Diego median home price exceeded half $1 million for the first time in a decade! Yes, the San Diego County median home price in October was over the $500,000 mark. For October the San Diego County median home price was $507,500. so far for the year San Diego home prices were up 11%.
Although this is an excellent report for San Diego County homeowners, the snapback in the San Diego median home price has a way to go before it reaches the levels set in our last housing boom. In November 2005 the San Diego County median home price in an all time record of $517,500! Read more
Home Prices Gain in March
Home Prices Gain

The S&P Case-Shiller index for March was just released today.On a national basis, this index showed a 5.2% gain from home prices in March 2016. This again was actually down slightly from 5.3% in February.
The highest year-over-year home price gains were shown by Portland, Seattle, and Denver. Portland led the way with a 10.3% year-over-year home price gain. This was followed by Seattle which had a 10.8% gain, and third-place was Denver with a 10% gain.
Here in San Diego California the S&P Case-Shiller index showed that for March our home prices increase by 1% from February 2016. On a year-over-year basis, San Diego’s home prices gained 6.2%. Read more